Plots
Advertisement

Christmas Plots Screensaver v.1.0
Christmas Plots Screensaver is another seasonal screensaver from FullScreensavers.com. It offers three nice scenes, all with a Christmas tree.
Advertisement
Message sequence plots visualizer v.0.9
Message sequence plots visualizer (MSP) create SVG files with this tool. MSP Visualizer creates SVG graphics suitable for viewing grouped variable plots together with messages between groups.

Christmas Plots v.1.0
Install this screensaver on your PC and dive into the unique charm of Christmas and New Year holidays. You will find Christmas candles in the frame of the Christmas tinsel, gifts on the window, snowman, snow drifts, and the Christmas tree with toys.
The African Plots Screensaver v.1.0
Undoubtedly, Africa is a fascinating and mysterious place. Almost all of us have dreamed about running a safari and traveling all over the African jungle.
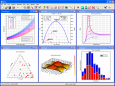
DPlot
DPlot is a general purpose graphing program designed for scientists, engineers, and students. It features multiple scaling types, including linear, logarithmic, and probability scales, as well as several special purpose XY graphs and contour plots of 3D
QtiPlot v.0.9.8.6
QtiPlot is a program for two- and three-dimensional graphical presentation of data sets and for data analysis. Plots can be produced from data sets stored in tables or from analytical functions.
DPLOT95 v.1 3
DPLOT95 is a software for creating and manipulating graphs in 1, 2, 3, and 4-D. With its help you you can create presentation-quality graphs as well as contour plots of 3-D and 4-D data while using data from a variety of sources.
EZplot v.1 1
EZplot is an Excel add-in and trademark of Office Expander. The software design is targeted to improve productivity in creating Excel plots and performing data calculations in Microsoft Excel (from the Microsoft Office Suite).
Contour Plot v.1 1
Real contour plots are created in Excel. You can interact with the contour plot just like any other Excel plot. Contour Plot works with any contour data. It accommodates rectangular data, nearly rectangular data, and irregular data.
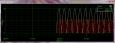
PlotPad v.1 2
PlotPad is a .net component that provides a visual control to visualize data in cartesian plots. Developers of WinForms applications can easily create xy-, yt- or scope-plots by simply feeding the component with their data.
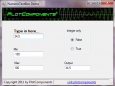
NumericTextBox v.1.0
PlotPad is a .net component that provides a visual control to visualize data in cartesian plots. Developers of WinForms applications can easily create xy-, yt- or scope-plots by simply feeding the component with their data.